At 9:02 on Monday morning, a public-facing firewall starts recording a port scan.
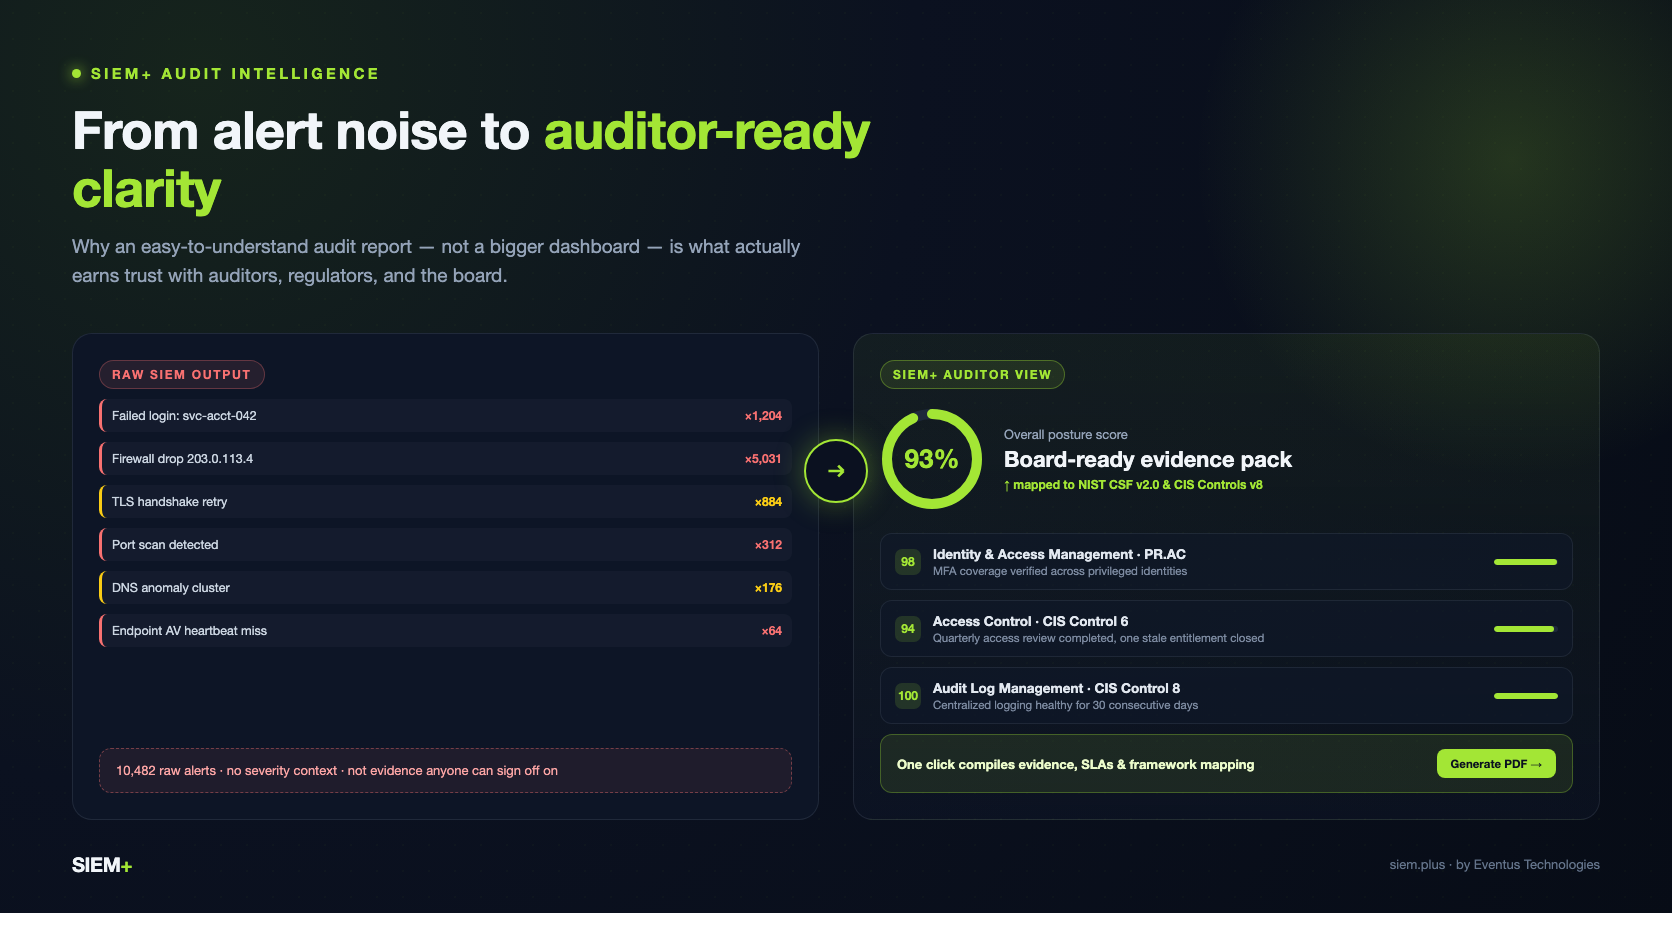
By 9:05, the SIEM has generated 5,000 alerts. The IT lead opens the dashboard, sees a wall of red, and asks the question every small security team eventually asks:
“Can’t we just put AI on top of the SIEM and have it tell us what matters?”
It is a reasonable question. The right direction is, in fact, AI on top of SIEM. Your existing SIEM already collects events, applies detection rules, and stores the evidence. An AI layer can translate that output into priorities, explanations, and next actions.
That is the idea behind SIEM+, an AI security overlay for teams that want better triage and clearer security posture without replacing the SIEM they already operate.
A generic chatbot, a one-off LLM script, or a loosely connected AI copilot may produce an impressive answer to one alert. Security operations require something more durable: a system that remembers context, groups related evidence, respects data boundaries, tracks posture over time, and produces outputs people can act on and defend later.